
Moving closer to parents, grown children, or grandchildren can make some things easier and others harder. AmeriSafe Van Lines compared the 100 largest U.S. metro areas on housing, space, childcare, care for older adults, healthcare, travel, and jobs. A separate survey of over 1,000 U.S. adults asked how holiday visits shape thoughts about living closer to family.
Key Takeaways
-
Atlanta ranks first among the 100 largest U.S. metros for a multi-generational move, just ahead of Birmingham and Dallas.
-
The leader changes with family priorities: Des Moines for raising kids near grandparents, McAllen for supporting aging parents, and Raleigh for shared households focused on jobs. Dallas is the only metro in all three scenario top 10s.
-
27% of respondents said a holiday visit has made them seriously consider moving closer to family; 6% of all respondents went on to move.
-
Watching a parent or grandparent get older was the most common reason, cited by 31% of those who considered moving.
-
46% would accept a pay cut to live within 30 minutes of family, or to stay there.
The Best Metros for a Multigenerational Move
Each metro is scored on eight measures and compared with the other 99. Scores are rescaled so the highest-scoring metro is 100, and the lowest is 0. They compare metros within this ranking and aren’t percentages, percentiles, or grades. On this 0 to 100 scale, 8.3 points separate first and 10th place, and close positions can shift under different weightings.
| Rank | Metro area | Overall Index Score |
|---|---|---|
| 1 | Atlanta, GA | 100 |
| 2 | Birmingham, AL | 99.2 |
| 3 | Dallas, TX | 98.9 |
| 4 | Wichita, KS | 97.4 |
| 5 | Houston, TX | 95.9 |
| 6 | Pittsburgh, PA | 95.9 |
| 7 | Des Moines, IA | 94.4 |
| 8 | Jackson, MS | 93.2 |
| 9 | St. Louis, MO | 92.5 |
| 10 | Kansas City, MO | 91.7 |
Explore the full ranking: all 100 metros and eight component scores
Scroll horizontally to compare all eight component scores. “Not available” marks missing airport connectivity data. Scores are relative to the metros in this study, not percentages or grades.
| Rank | Metro area | Overall Index Score | Housing affordability | Extra-bedroom supply | Multigenerational growth | Childcare cost | Caregiving services | Healthcare access | Airport connectivity | Job access |
|---|---|---|---|---|---|---|---|---|---|---|
| 1 | Atlanta, GA | 100 | 69 | 74 | 37 | 91 | 39 | 41 | 71 | 55 |
| 2 | Birmingham, AL | 99.2 | 89 | 62 | 42 | 96 | 38 | 57 | 38 | 37 |
| 3 | Dallas, TX | 98.9 | 68 | 64 | 37 | 90 | 48 | 41 | 74 | 59 |
| 4 | Wichita, KS | 97.4 | 99 | 68 | 36 | 92 | 40 | 43 | 37 | 27 |
| 5 | Houston, TX | 95.9 | 66 | 69 | 41 | 88 | 56 | 34 | 69 | 49 |
| 6 | Pittsburgh, PA | 95.9 | 99 | 56 | 39 | 71 | 45 | 48 | 56 | 41 |
| 7 | Des Moines, IA | 94.4 | 93 | 64 | 31 | 100 | 29 | 42 | 45 | 34 |
| 8 | Jackson, MS | 93.2 | 91 | 61 | 39 | 90 | 58 | 57 | 28 | 22 |
| 9 | St. Louis, MO | 92.5 | 94 | 58 | 38 | 73 | 36 | 45 | 57 | 48 |
| 10 | Kansas City, MO | 91.7 | 84 | 62 | 38 | 80 | 36 | 52 | 55 | 46 |
| 11 | Grand Rapids, MI | 91.7 | 90 | 64 | 39 | 93 | 30 | 41 | 48 | 31 |
| 12 | Little Rock, AR | 90.6 | 91 | 54 | 35 | 86 | 44 | 63 | 38 | 32 |
| 13 | San Antonio, TX | 90.2 | 73 | 63 | 39 | 87 | 53 | 42 | 57 | 39 |
| 14 | Philadelphia, PA | 90.2 | 76 | 56 | 35 | 75 | 52 | 50 | 61 | 54 |
| 15 | Austin, TX | 89.8 | 66 | 59 | 36 | 92 | 43 | 35 | 61 | 67 |
| 16 | Raleigh, NC | 89.5 | 77 | 65 | 37 | 75 | 34 | 34 | 62 | 70 |
| 17 | Detroit, MI | 88.3 | 86 | 55 | 34 | 87 | 32 | 45 | 62 | 41 |
| 18 | Baton Rouge, LA | 87.2 | 84 | 58 | 37 | 97 | 55 | 38 | 27 | 37 |
| 19 | Fayetteville, AR | 86.5 | 89 | 57 | 39 | 91 | 40 | 36 | 37 | 39 |
| 20 | Minneapolis, MN | 85.7 | 85 | 66 | 36 | 53 | 36 | 45 | 64 | 60 |
| 21 | Omaha, NE | 85.3 | 85 | 64 | 38 | 79 | 28 | 50 | 48 | 40 |
| 22 | Ogden, UT | 85 | 77 | 85 | 48 | 79 | 28 | 42 | 33 | 37 |
| 23 | Greenville, SC | 85 | 89 | 60 | 37 | 75 | 41 | 43 | 41 | 44 |
| 24 | Harrisburg, PA | 84.2 | 91 | 59 | 36 | 71 | 50 | 51 | 37 | 35 |
| 25 | Richmond, VA | 83.8 | 74 | 65 | 33 | 78 | 42 | 62 | 49 | 37 |
| 26 | Salt Lake City, UT | 82.7 | 68 | 77 | 36 | 80 | 26 | 37 | 57 | 57 |
| 27 | Washington, DC | 82.7 | 73 | 62 | 37 | 76 | 24 | 39 | 72 | 57 |
| 28 | McAllen, TX | 82 | 86 | 57 | 39 | 65 | 98 | 32 | 34 | 23 |
| 29 | Baltimore, MD | 82 | 76 | 62 | 35 | 69 | 26 | 52 | 69 | 48 |
| 30 | Chicago, IL | 81.6 | 76 | 56 | 40 | 66 | 27 | 46 | 78 | 53 |
| 31 | Augusta, GA | 80.8 | 87 | 68 | 42 | 88 | 42 | 45 | 19 | 22 |
| 32 | Provo, UT | 80.5 | 73 | 91 | 35 | 75 | 33 | 25 | 47 | 43 |
| 33 | Nashville, TN | 80.5 | 70 | 52 | 34 | 93 | 30 | 38 | 65 | 52 |
| 34 | Charlotte, NC | 79.3 | 76 | 60 | 31 | 72 | 31 | 36 | 63 | 61 |
| 35 | Chattanooga, TN | 78.6 | 89 | 55 | 39 | 89 | 32 | 47 | 30 | 29 |
| 36 | Cincinnati, OH | 78.6 | 87 | 62 | 38 | 62 | 29 | 47 | 54 | 41 |
| 37 | Columbia, SC | 78.2 | 82 | 65 | 36 | 77 | 41 | 50 | 31 | 35 |
| 38 | Oklahoma City, OK | 78.2 | 86 | 57 | 44 | 70 | 42 | 42 | 46 | 32 |
| 39 | Charleston, SC | 77.4 | 69 | 60 | 40 | 86 | 30 | 40 | 52 | 51 |
| 40 | Knoxville, TN | 76.7 | 85 | 53 | 34 | 85 | 32 | 46 | 45 | 31 |
| 41 | El Paso, TX | 75.9 | 70 | 63 | 35 | 88 | 63 | 37 | 44 | 18 |
| 42 | New Orleans, LA | 75.2 | 59 | 55 | 38 | 88 | 52 | 51 | 59 | 29 |
| 43 | Tulsa, OK | 75.2 | 88 | 57 | 37 | 70 | 42 | 44 | 43 | 29 |
| 44 | Boise City, ID | 74.8 | 70 | 64 | 42 | 84 | 32 | 36 | 50 | 40 |
| 45 | Indianapolis, IN | 74.4 | 88 | 62 | 48 | 45 | 32 | 51 | 55 | 37 |
| 46 | Virginia Beach, VA | 74.4 | 65 | 64 | 36 | 80 | 43 | 51 | 49 | 33 |
| 47 | Winston-Salem, NC | 73.7 | 80 | 53 | 39 | 75 | 37 | 45 | Not available | 28 |
| 48 | Cleveland, OH | 73.3 | 91 | 61 | 39 | 44 | 31 | 52 | 57 | 39 |
| 49 | Memphis, TN | 72.9 | 71 | 64 | 41 | 80 | 37 | 46 | 46 | 28 |
| 50 | Phoenix, AZ | 70.7 | 65 | 62 | 31 | 66 | 29 | 35 | 75 | 58 |
| 51 | Albany, NY | 69.9 | 82 | 54 | 39 | 65 | 29 | 56 | 42 | 40 |
| 52 | Columbus, OH | 69.5 | 81 | 57 | 34 | 59 | 35 | 43 | 54 | 46 |
| 53 | Allentown, PA | 68.8 | 74 | 59 | 38 | 68 | 42 | 48 | 41 | 37 |
| 54 | Akron, OH | 67.3 | 93 | 61 | 34 | 45 | 32 | 46 | Not available | 29 |
| 55 | Durham, NC | 66.5 | 66 | 52 | 37 | 61 | 31 | 62 | 62 | 47 |
| 56 | Orlando, FL | 66.2 | 50 | 62 | 45 | 70 | 29 | 40 | 76 | 49 |
| 57 | Rochester, NY | 64.7 | 85 | 59 | 43 | 52 | 33 | 47 | 43 | 29 |
| 58 | Tampa, FL | 64.3 | 57 | 52 | 44 | 66 | 29 | 44 | 70 | 56 |
| 59 | Madison, WI | 64.3 | 74 | 52 | 39 | 74 | 29 | 50 | 38 | 39 |
| 60 | Jacksonville, FL | 63.9 | 64 | 62 | 35 | 73 | 28 | 43 | 51 | 44 |
| 61 | Milwaukee, WI | 63.5 | 74 | 51 | 43 | 55 | 34 | 58 | 49 | 39 |
| 62 | Albuquerque, NM | 62.8 | 80 | 55 | 46 | 50 | 46 | 42 | 49 | 26 |
| 63 | Syracuse, NY | 61.7 | 91 | 61 | 34 | 51 | 28 | 47 | 43 | 24 |
| 64 | Buffalo, NY | 60.5 | 87 | 58 | 35 | 48 | 31 | 44 | 50 | 29 |
| 65 | Greensboro, NC | 59.8 | 77 | 53 | 38 | 69 | 40 | 34 | 38 | 34 |
| 66 | Toledo, OH | 59.8 | 94 | 60 | 44 | 42 | 32 | 48 | 38 | 18 |
| 67 | Denver, CO | 59.4 | 60 | 61 | 27 | 45 | 24 | 46 | 80 | 65 |
| 68 | Louisville, KY | 59.4 | 90 | 18 | 37 | 82 | 29 | 42 | 46 | 34 |
| 69 | Cape Coral, FL | 55.6 | 61 | 46 | 40 | 78 | 26 | 35 | 56 | 43 |
| 70 | Tucson, AZ | 52.3 | 69 | 58 | 29 | 63 | 32 | 45 | 44 | 32 |
| 71 | Spokane, WA | 50 | 73 | 66 | 39 | 53 | 12 | 46 | 47 | 28 |
| 72 | Palm Bay, FL | 49.2 | 64 | 56 | 38 | 82 | 28 | 40 | 25 | 27 |
| 73 | Sacramento, CA | 48.9 | 48 | 56 | 39 | 52 | 43 | 42 | 58 | 51 |
| 74 | Lakeland, FL | 45.1 | 62 | 60 | 46 | 57 | 29 | 28 | Not available | 30 |
| 75 | New York, NY | 44 | 37 | 38 | 34 | 63 | 38 | 50 | 74 | 59 |
| 76 | Dayton, OH | 41.4 | 91 | 23 | 32 | 49 | 30 | 56 | 33 | 30 |
| 77 | Seattle, WA | 41.4 | 50 | 46 | 38 | 53 | 9 | 42 | 69 | 65 |
| 78 | Deltona, FL | 41 | 63 | 50 | 32 | 71 | 28 | 36 | 32 | 35 |
| 79 | Colorado Springs, CO | 40.2 | 58 | 76 | 40 | 38 | 26 | 33 | 43 | 40 |
| 80 | Las Vegas, NV | 39.8 | 47 | 60 | 37 | 44 | 32 | 33 | 73 | 43 |
| 81 | North Port, FL | 39.5 | 51 | 41 | 33 | 77 | 25 | 38 | 50 | 41 |
| 82 | Boston, MA | 38.3 | 55 | 40 | 38 | 38 | 23 | 51 | 67 | 58 |
| 83 | Hartford, CT | 36.5 | 77 | 52 | 39 | 21 | 26 | 33 | 52 | 44 |
| 84 | Portland, OR | 33.5 | 58 | 50 | 33 | 42 | 10 | 43 | 62 | 50 |
| 85 | Kiryas Joel, NY | 33.5 | 59 | 32 | 35 | 68 | 28 | 49 | Not available | 26 |
| 86 | Providence, RI | 30.5 | 51 | 42 | 45 | 51 | 19 | 43 | 59 | 36 |
| 87 | Worcester, MA | 30.5 | 64 | 50 | 41 | 38 | 25 | 45 | 31 | 40 |
| 88 | Miami, FL | 27.1 | 26 | 39 | 39 | 61 | 32 | 42 | 74 | 46 |
| 89 | San Francisco, CA | 25.9 | 32 | 23 | 32 | 51 | 40 | 51 | 67 | 68 |
| 90 | San Jose, CA | 25.9 | 30 | 18 | 35 | 64 | 39 | 47 | 60 | 66 |
| 91 | Riverside, CA | 25.2 | 37 | 60 | 46 | 32 | 44 | 32 | 55 | 40 |
| 92 | Stockton, CA | 19.2 | 45 | 61 | 40 | 34 | 40 | 30 | 40 | 30 |
| 93 | San Diego, CA | 18 | 18 | 35 | 43 | 52 | 37 | 41 | 66 | 56 |
| 94 | Los Angeles, CA | 15.4 | 5 | 28 | 37 | 63 | 49 | 41 | 75 | 56 |
| 95 | Oxnard, CA | 13.9 | 32 | 51 | 38 | 49 | 38 | 38 | Not available | 31 |
| 96 | Bridgeport, CT | 7.5 | 54 | 49 | 38 | 10 | 26 | 33 | Not available | 50 |
| 97 | New Haven, CT | 4.9 | 62 | 47 | 43 | 0 | 24 | 33 | 52 | 29 |
| 98 | Honolulu, HI | 4.5 | 30 | 32 | 46 | 61 | 22 | 43 | Not available | 26 |
| 99 | Fresno, CA | 4.5 | 45 | 55 | 38 | 4 | 52 | 35 | 40 | 31 |
| 100 | Bakersfield, CA | 0 | 48 | 59 | 42 | 15 | 45 | 28 | 21 | 19 |
Download the complete ranking as a CSV. Blank CSV cells indicate unavailable data. View the published interactive ranking.
Atlanta leads on the strength of its childcare cost (91) and extra-bedroom supply (74) component scores, though it scores 41 on healthcare access.
Raleigh has the highest job access score of any metro (70) but ranks 16th overall, partly because its healthcare access score (34) is below the 100-metro median (43).
Childcare cost and housing affordability set the leaders apart. The top 25 metro areas average scores of 84 and 83 on those measures, compared with 43 and 48 for the bottom 25.
Niche Top 10 Metro Areas for Multigenerational Moves
Top 10 Cities for Raising Children Near Grandparents
This list weighs childcare cost most heavily, followed by extra bedrooms and housing affordability.
- Des Moines, IA
- Birmingham, AL
- Wichita, KS
- Atlanta, GA
- Grand Rapids, MI
- Dallas, TX
- Jackson, MS
- Baton Rouge, LA
- Ogden, UT
- Fayetteville, AR
Top 10 Cities for Supporting Aging Parents
This list centers on the local care workforce and access to healthcare, with housing affordability close behind.
- McAllen, TX
- Jackson, MS
- Philadelphia, PA
- Pittsburgh, PA
- Little Rock, AR
- Harrisburg, PA
- Richmond, VA
- Houston, TX
- Dallas, TX
- San Antonio, TX
Top 10 Cities for Shared Households With Job Access in Mind
This list puts the most weight on job access, followed by airport connectivity, extra bedrooms, and housing affordability.
- Raleigh, NC
- Minneapolis, MN
- Atlanta, GA
- Dallas, TX
- Denver, CO
- Washington, DC
- Chicago, IL
- Charlotte, NC
- Salt Lake City, UT
- Austin, TX
When a Holiday Visit Becomes a Moving Decision
AmeriSafe surveyed 1,006 U.S. adults about holiday visits, moving closer to family, and the trade-offs involved. The results reflect what people reported and are separate from the metro ranking. Respondents were first asked whether a holiday visit with family had ever made them seriously consider moving closer, and what tipped them toward it.
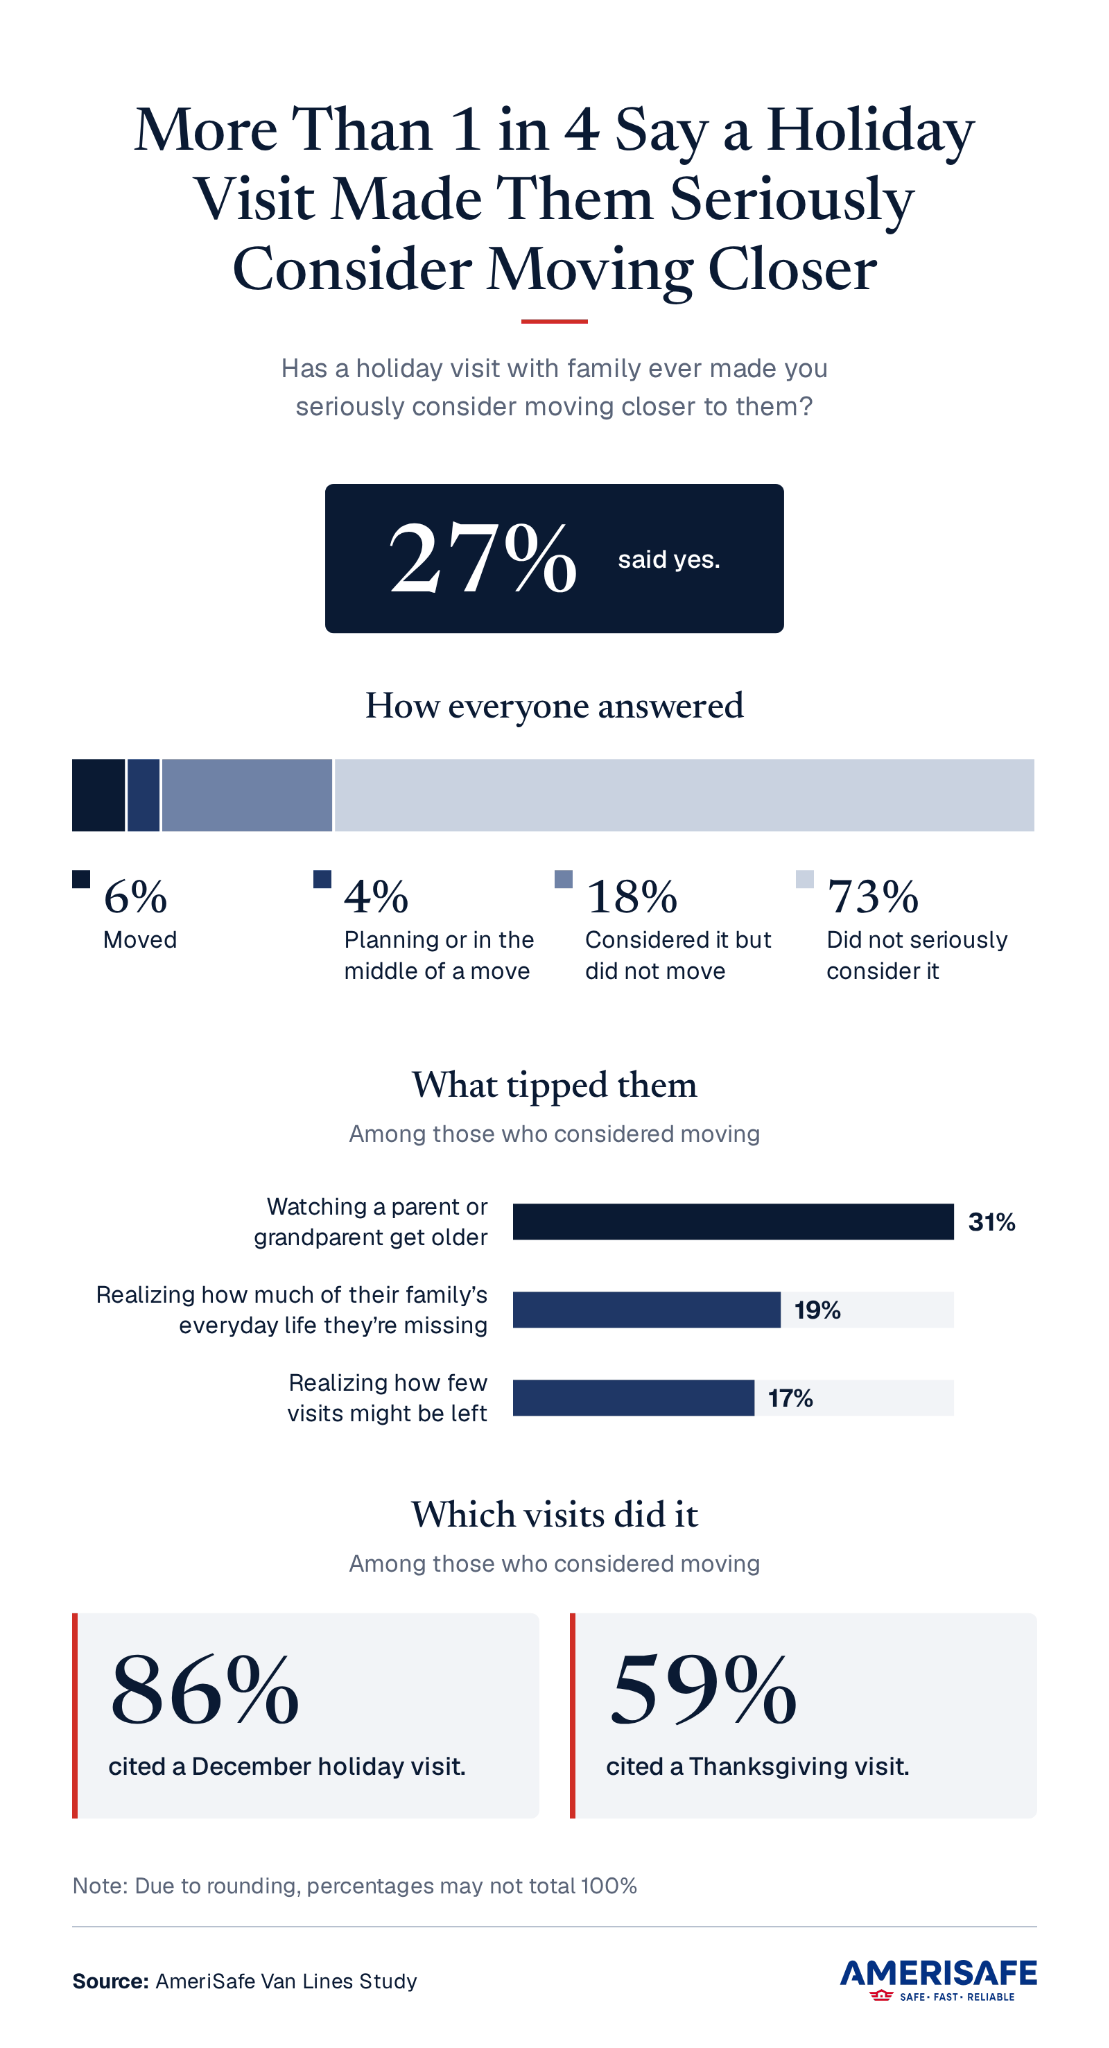
27% of respondents said a holiday visit has made them seriously consider moving closer. Of all respondents, 6% have already moved, and 4% are planning to move or are in the middle of one.
Watching a parent or grandparent get older was the most common reason (31% of those who considered moving). The goodbye at the airport or in the driveway was chosen by 5% of respondents.
Among those who considered moving, more cited December holiday visits (86%) than Thanksgiving visits (59%); respondents could pick more than one.
18% of all respondents started researching a move during or right after a Thanksgiving or December visit.
What Gets in the Way, and Who Should Move
Respondents named the biggest thing keeping them from living closer to family and said who, if anyone, should make the move.
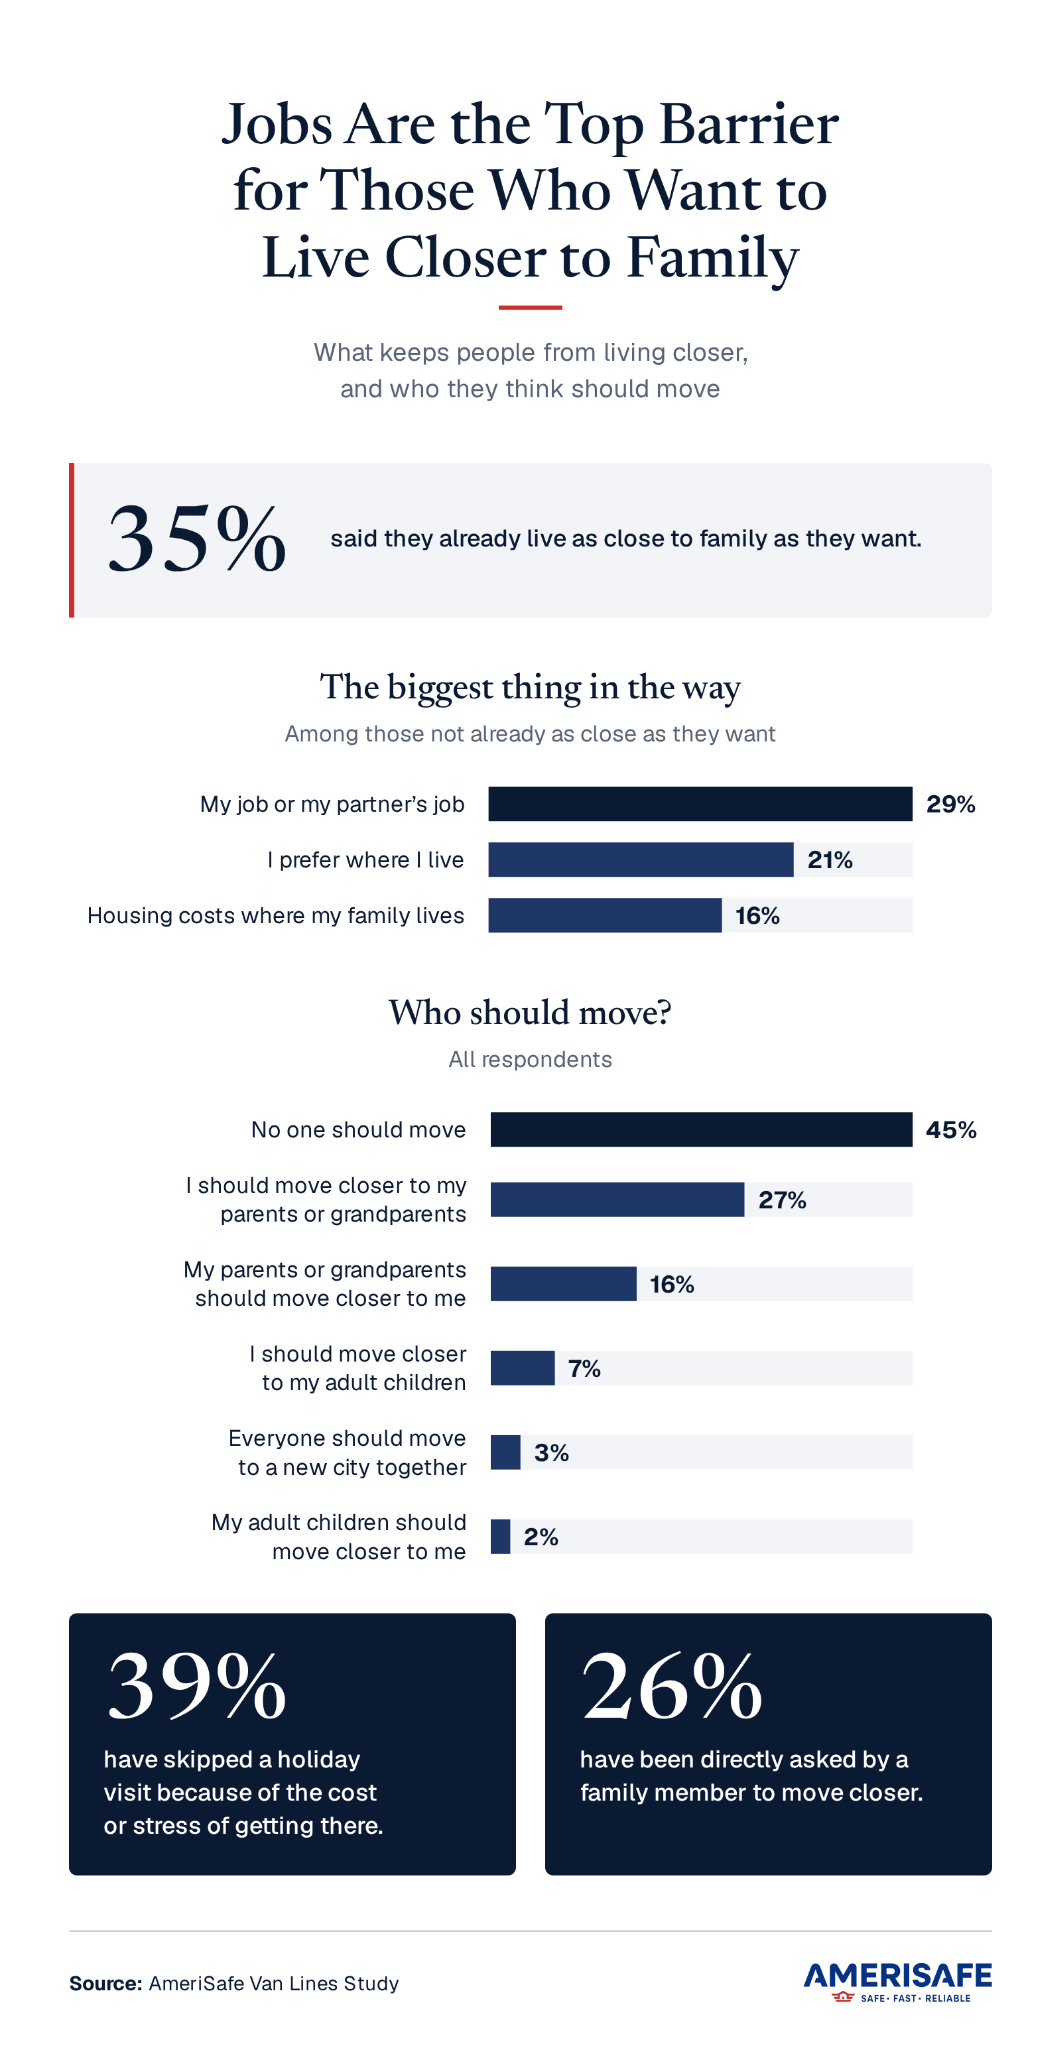
35% of respondents already live as close to family as they want.
Among the other respondents, jobs were the top barrier (29%), ahead of liking where they live (21%) and housing costs near family (16%).
45% said no one should move, but 27% said they should be the one to move closer to parents or grandparents. These are individual views, not family agreements.
39% have skipped a holiday visit because of the cost or stress of getting there, and 26% have been asked by a relative to move closer.
The Financial Trade-Off of Living Near Family
Respondents were asked about the largest pay cut they would accept to live within 30 minutes of family and how often they lean on nearby relatives.
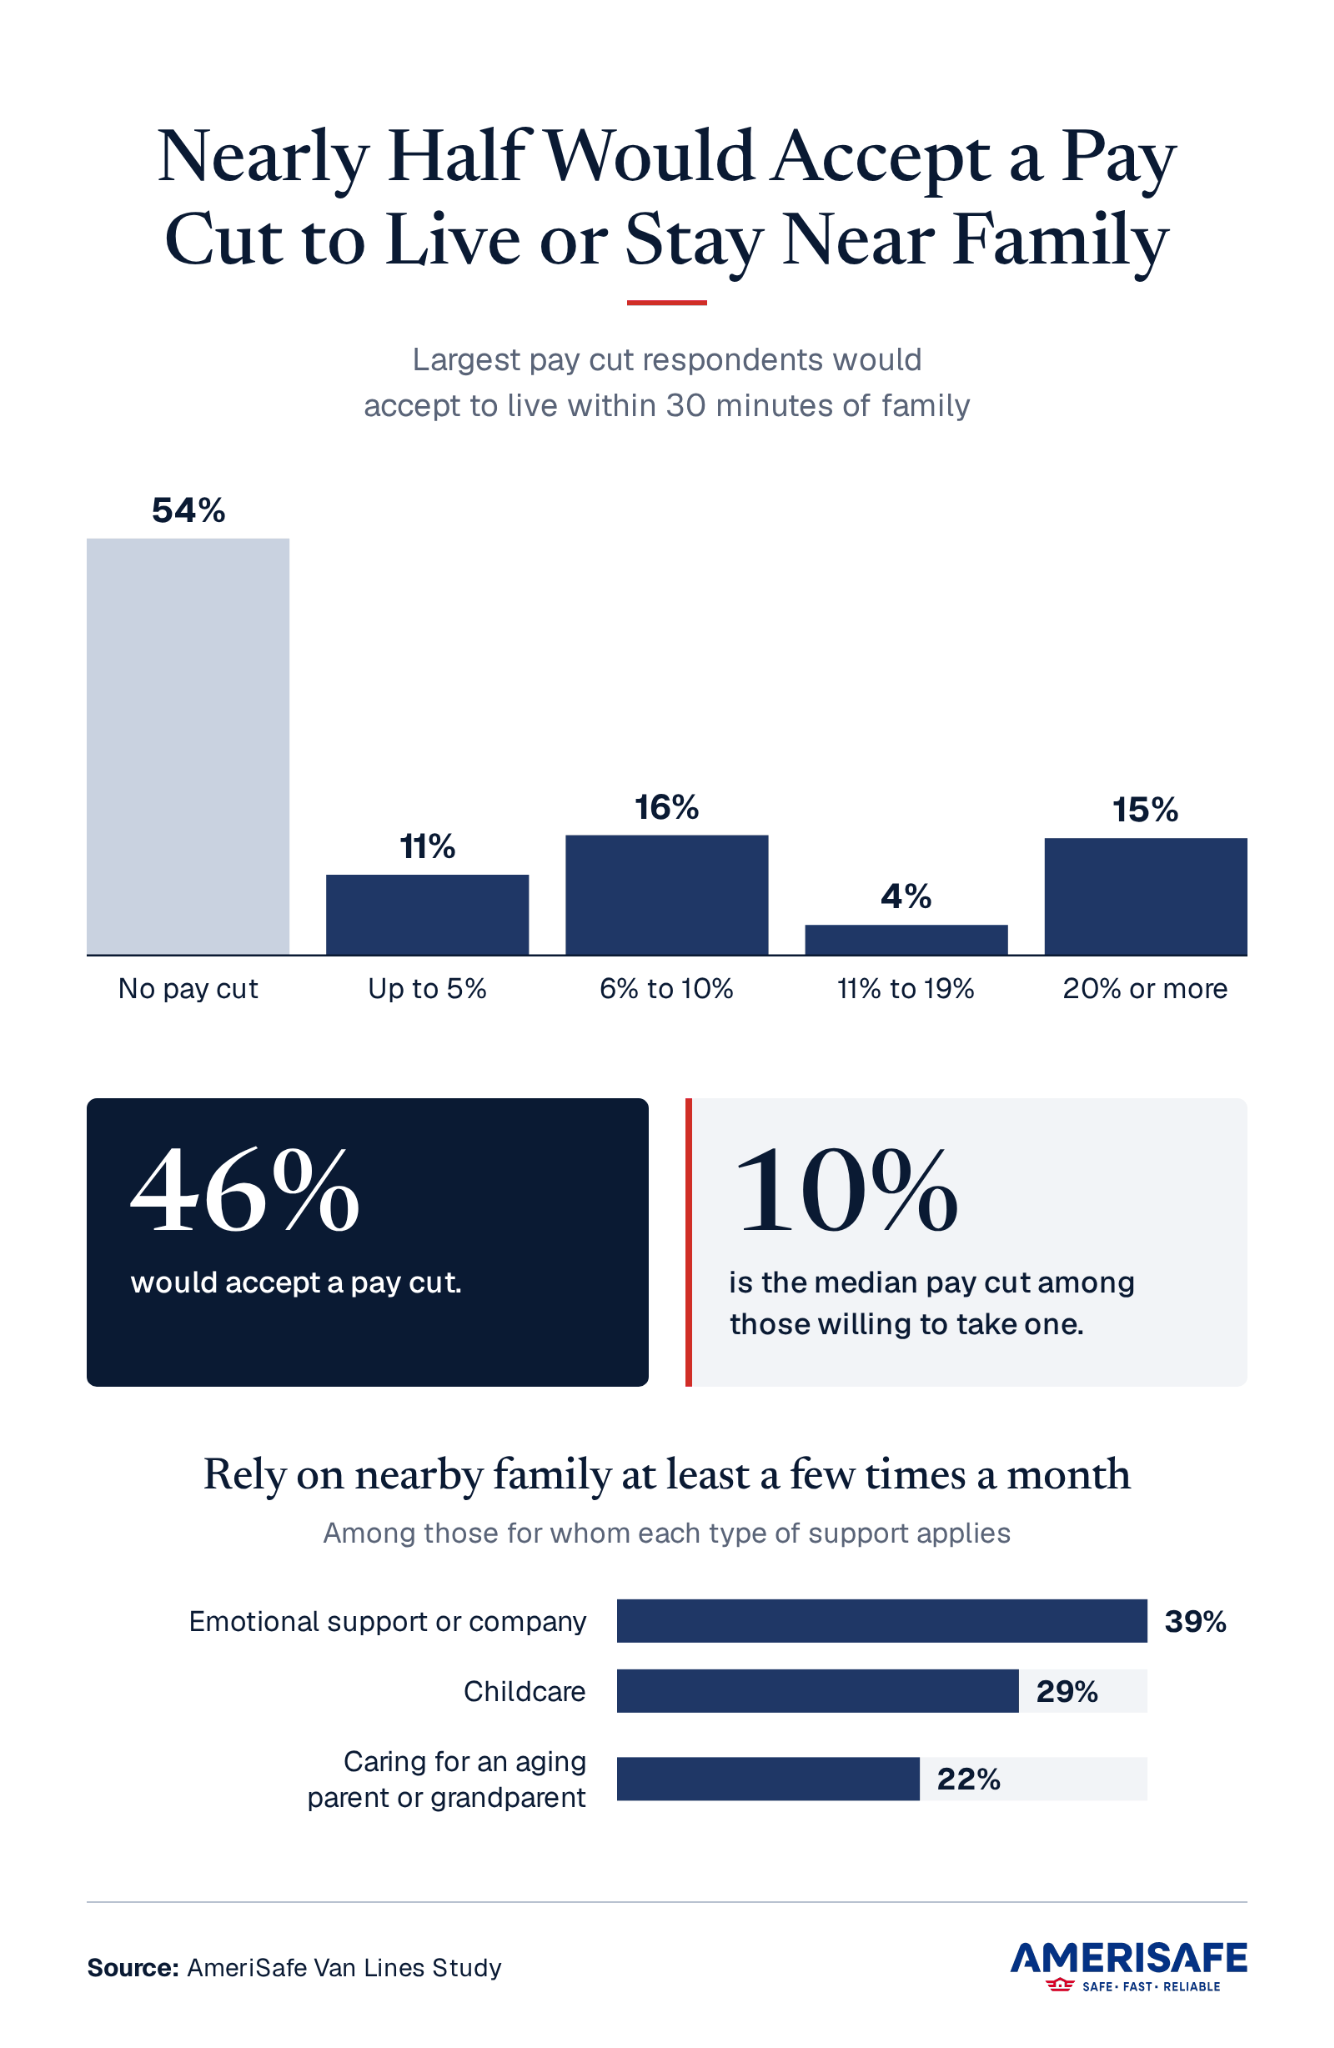
46% of respondents would accept a pay cut to live within 30 minutes of family, or to stay there, while 54% would not.
Among those willing, the median pay cut was 10%, and 15% of all respondents would accept a cut of 20% or more.
Among those for whom each applies, 39% rely on nearby family for emotional support at least a few times a month, while 29% do so for childcare and 22% for caring for an aging parent or grandparent.
Methodology
AmeriSafe Van Lines ranked the 100 largest U.S. metros by 2024 population using eight weighted categories: housing affordability (20%), extra-bedroom supply (15%), childcare cost (15%), multigenerational household growth (10%), caregiving services (10%), healthcare access (10%), airport connectivity (10%), and job access (10%). Sources included the U.S. Census Bureau, Zillow, the Department of Labor, Child Care Aware of America, BLS, HRSA, FAA, and BTS, with data spanning 2019–2026.
Measures were normalized and combined into weighted scores. Three niche rankings reweighted the categories for different family priorities. Final scores were scaled from 0 to 100 within each ranking, representing the lowest and highest scores across the 100 metros, not percentages or absolute measures of quality. Niche-ranking minimums were reconstructed from rounded component data. Missing measures were handled by reweighting available measures. Childcare prices reflect 2022 data adjusted to 2024 dollars and may understate costs in some states. Aide wages are not consumer care prices, housing measures are not active listings, and airport destinations are not necessarily nonstop routes.
Separately, AmeriSafe surveyed 1,006 U.S. adults ages 18 and older on October 27, 2026, through Connect powered by CloudResearch. Results are unweighted and reflect self-reported experiences and hypothetical preferences. Question bases vary by eligibility and applicability; multiple-choice selections and rounding may prevent totals from equaling 100%. Holiday findings cover Thanksgiving and other holidays.
About AmeriSafe Van Lines
AmeriSafe Van Lines helps households plan interstate and specialty-item relocations with written estimates and clear identification of the responsible carrier. Explore long-distance moving services today.
Fair Use Statement
You are welcome to share this study and its graphics for noncommercial purposes. Please credit AmeriSafe Van Lines and link back to this study so readers can review the findings and methodology.